
Financial management is essential, whether you’re thinking about starting your own business, working in the corporate world or just having people think that you’re intelligent. We do all the groundwork so that you do not have to.
Financial Management
Owner’s Equity
Owner’s Equity = Assets – Liabilities
Owner’s Equity is the shares belonging to the business’s owner.
Assets are all things that the business owns, including inventory, cash, property and equipment.
Liabilities are obligations that the business must pay, including debts like suppliers, rentals and fees.
Liquidity Ratio
Liquidity Ratio is a metric to measure whether the company have the means to pay its short-term debts. The most common three liquidity ratios are current ratio, quick ratio and operating cash flow ratio.

Remarks: The Liquidity Ratio has a fixed “Current Liabilities” denominator.
Generally, we would want the ratio to exceed 1 as this would imply that the assets are higher than liabilities. When a company’s liability exceeds its assets, that is usually a bad sign.
- Current Ratio = Current Assets / Current Liabilities
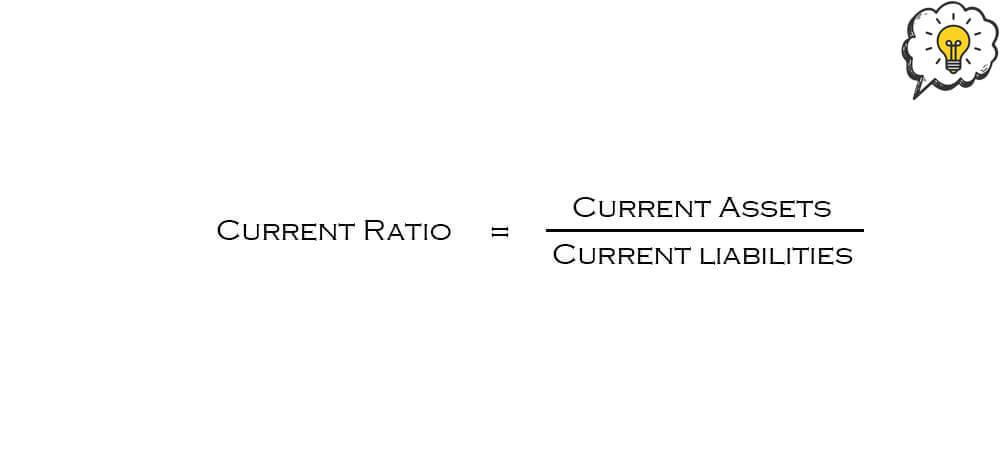
Current Assets is the money that is going to come in the coming 12 months (Typically within one year).
Current Liabilities is to see if there’s enough money to pay in the next 12 months (Typically within one year).
- Quick Ratio = (Current Assets – Inventory) / Current Liabilities
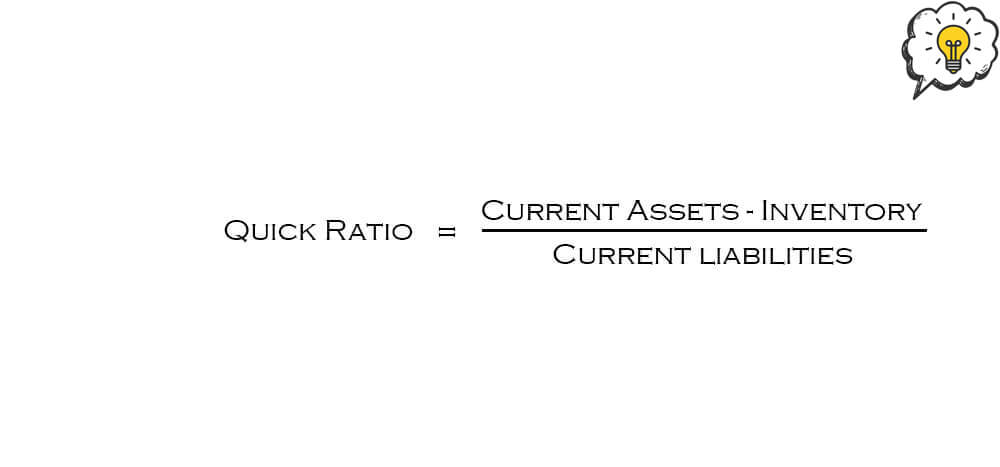
Current Assets include inventory. What happens if the inventory could not be converted to cash? The inventory can be removed, this is called “Quick Ratio”.
- Operating Cash Flow Ratio (OCF) = Cash Flow from Operations / Current Liabilities
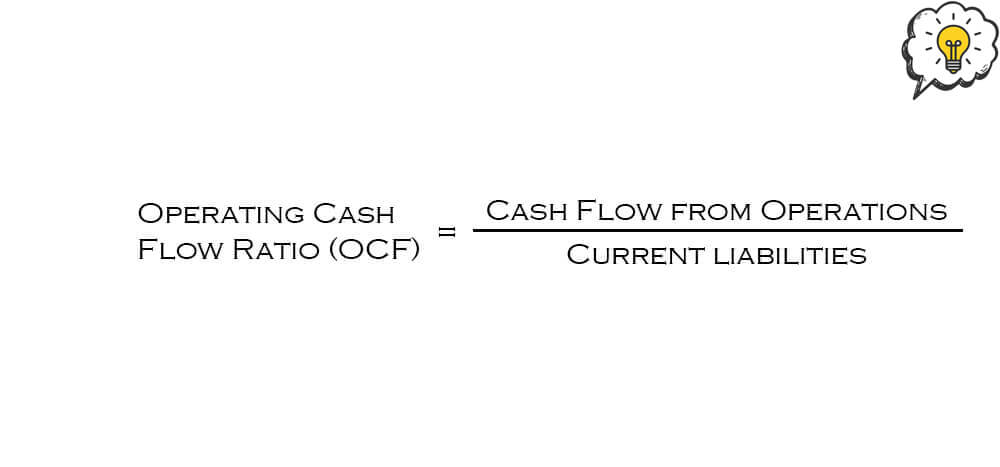
It represents the amount of money that a company produces solely from its core business activities. Negative OCF suggests that the company does not produce adequate sales from its core business activities.
Financial Leverage Ratio
Financial Leverage Ratio is a metric to measure to what extend the company uses borrowed money to fund the business.
Assets = Equity + Debt (Liabilities)
- Total Debt Ratio = (Total Assets – Total Equity) / Total Assets
Example: If the output is 0.28, it means 28% of the company’s asset are funded by borrowing money and remaining 72% is shareholder’s money
The higher the ratio, the higher bankruptcy risk
- Debt-equity Ratio = Total Debt / Total Equity
- Equity Multiplier = Total Assets / Total Equity = 1 + Debt / Equity
- Times Interest Earned = Earnings before interest & taxes (EBIT) / Interest
Remarks: This is what the bank wants to see if you’re going to need a loan.
- Cash Coverage = (EBIT + Depreciation) / Interest
Remarks: This is what the bank wants to see if you’re going to need a loan.
Asset Management Ratio
Asset Management Ratio is a metric to measure how well the company convert their assets into products and sales
- Total Asset Turnover= Sales / Total Assets
Example: If the output is 2, means for every $1 in assets, it generates $2 in sales
Sales can be taken from income statement while Total Assets can be taken from balance sheet.
- Inventory Turnover = Cost of goods sold (COGS) / Average Turnover
Remarks: COGS taken from income statement while average turnover taken from balance sheet
This is to see how many times (usually in a year) how many times the company stock up, sold to 0 then replenish. (But in reality, companies do not stock up when inventory goes to 0)
- Receivable Turnover = Sales / Account Receivable
Remarks: How fast the company collects the receivables
Remarks: The higher output. the better it is. This means that the company is in a position to collect funds very quickly.
- Day’s sales in receivables = 365 / Receivable Turnover
Example: The output represents how many days a company collects its payment after selling a product.
Profitability Ratio
- Net Profit Margin = Net Income / Sales
Example: If the output is 0.2. It means for every $100, $20 is net profit while $80 goes to cost.
- Gross Profit Margin = Sales – Cost of Goods Sold(COGS) / Sales
Example: If the output is 0.2. It means for every $100, $20 is gross profit while $80 goes to cost.
COGS are raw materials and expenditures specifically related to the production of the main commodity of the business, not counting operating costs such as leasing, utility, freight or payroll. F&B companies usually have higher difference in gross profit margin than net profit margin.
- Operating Profit Margin = EBIT / Sales
Example: If the output is 0.3. It means $30 is operating profit for every $100.
- Return on Assets (ROA) = Net Income / Total Assets
Example: If the output is 0.1. It means for every $100 of company’s assets, the company generates $10 of income.
Net Income is taken from income statement while Total Assets taken from balance sheet.
- Return of Equity (ROE) = Net Income / Total Equity
Example: If the output is 0.08. It means for every $100 of shareholder’s money, the company generates $8 of profit)
Market Value Ratio
Remarks: Market Value Ratio is only valid if the company is listed and has a share price.
- PE Ratio = Price per share / Earnings per share
This is to allow investors see the prospect of the company.
PE ratio would be higher if investors consider the company as a good prospect.
- Price-Sales Ratio = Price per share / sales per share
This is for companies that are not earning money.
- Market-to-book Ratio = Price per share / Book value per share
Book value is taken from the balance sheet.